Research Article | Volume 14, Issue 2, March, 2026
Generation mean analysis of quality protein maize (Zea mays L.) using a six-parameter genetic model for grain yield and biochemical characters in sub-humid climatic conditions of Odisha
K. Vinay Teja1, K. Krishnam Raju1, Anjan Roy1, Satyabrata Nanda2, Poulami Sil3, Swapnil1, Vidadala Rajendra1, Sanghamitra Rout1, Rajneesh Kumar4, Ajaz A. Lone5
1Department of Genetics and Plant Breeding, Centurion University of Technology and Management, Gajapati, Odisha, India.
2Department of Plant Biotechnology, Centurion University of Technology and Management, Gajapati, Odisha, India.
3Department of Biochemistry and Plant Physiology, Centurion School of Smart Agriculture, Vizianagaram.
4Department of Genetics and Plant Breeding, Faculty of Agriculture, Sher-e-Kashmir University of Agricultural Sciences and Technology (SKUAST–K), Wadura, Jammu and Kashmir, India.
5Dryland Agriculture Research Station, Srinagar, Jammu and Kashmir, India.
This study was conducted on quality protein maize crosses, CML138 × CML145 and CML334 × CML330, to assess genetic effects and the nature of gene action governing morphological and biochemical traits. The significant results from all four scaling tests and the six-parameter model highlighted the roles of additive (d), dominance (h), and epistatic effects (i, j, and l) in the inheritance of morphological, biochemical, and grain yield-related traits. Dominance variance (h) had a greater influence than variance (d), with duplicate epistatic interactions observed for most traits, except plant height in CML138 × CML145 (h) = 23.944, (l) = 22.656, and catalase activity in CML334 × CML330 (h) = 0.083, (l) = 0.121, which exhibited complementary gene action. Traits exhibiting duplicate gene action, such as grain yield per plant in CML138 × CML145 (h) = 1757.704, (l) = −2088.704 and plant height in CML334 × CML330 (h) = 108.636, (l) = −162.936, exhibited significant dominance (h) and dominance × dominance (l) interactions. Dominance variance and duplicate epistasis played a crucial role in the inheritance of these traits. To enhance these characteristics, selection in successive populations following a biparental mating approach would be beneficial.
Teja KV, Raju KK, Roy A, Nanda S, Sil P, Swapnil, Rajendra V, Rout S, Kumar R, Lone AA. Generation mean analysis of quality protein maize (Zea mays L.) using a six-parameter genetic model for grain yield and biochemical characters in sub-humid climatic conditions of Odisha. J Appl Biol Biotech 2026;14(2):108-117. http://doi.org/10.7324/JABB.2026.249256
Maize (Zea mays L.) is the world’s most important cereal crop, essential for human food and livestock forage, earning it the title “Queen of Cereals.” The mid-1960s witnessed the emergence of maize mutants with the opaque-2 gene, which enhanced lysine and tryptophan levels in the endosperm protein, leading to advancements in maize breeding focused on quality [1]. Due to its high concentration of vital amino acids, such as lysine and tryptophan, the genetically modified quality protein maize (QPM) helps address the nutritional deficiencies present in conventional maize. Since QPM enhances health and protein synthesis, it is a crucial tool for combating protein deficiency and improving nutritional standards. In areas where maize is a staple crop, QPM has excellent potential as a solution to nutritional deficiencies and food insecurity due to its high biological value and adaptability [1].
Understanding the gene activity behind traits such as yield and quality is crucial for genetically improving crops and informing breeding methods. Knowledge of genetic variance, dominance levels, and genetic effects has improved understanding of heterosis [2].
Grain yield and its components are quantitative traits that are polygenic and influenced by the type of gene action, specifically whether it is dominant, additive, or epistatic. Generation mean analysis (GMA) and scaling tests can identify digenic gene actions, particularly epistasis, whether complementary or duplicate. GMA effectively estimates the genetic factors influencing quantitative traits such as yield and quality, with Attri et al. [3] emphasizing the importance of epistasis in their inheritance. This study aimed to analyze the inheritance patterns of morphological, biochemical, and grain yield traits in maize to identify effective breeding methods for hybrid maize development.
2. MATERIALS AND METHODS
2.1. Plant Genetic Material
During the summer of 2022, from mid-February to mid-June, nine maize parent lines were selected for their morphological traits in the pedigree. Of these, six were female lines (CML 149, CML 334, and CML 143) and three heat-susceptible lines (CML 138, CML 332, and CML 167) that were crossed with three male resistant testers (CML 145, CML 193, and CML 330). The outcome was 18 F1 hybrids. Using a randomized block design, these hybrids and parental lines were tested for several agronomic attributes throughout the kharif season (mid-July to mid-October 2022).
The objective of the 2022 kharif season’s crossing program was to generate segregating populations, such as the backcross (BCP1) and second filial (F2) populations. Crossing F1 offspring with parent P1 produced BCP1, whereas crossing F1 offspring with parent P2 produced BCP2. The equivalent F1 plants were self-pollinated to create F2 populations.
Early flowering, antioxidant levels, considerable per se performance, conventional heterosis for grain production, and other features led to the identification of CML138 × CML145 and CML334 × CML330 as the two best of the 18 F1 hybrids [4]. To learn more about how genes work, participants were chosen to undergo GMA.
2.2. Field Evaluation
This study included four parents (CML138, CML145, CML334, and CML330), two F1 hybrids (CML138 × CML145 and CML334 × CML330), and their respective F2, BCP1, and BCP2 populations. From mid-February to mid-June 2023, an assessment was conducted at the P.G. Research Farm of the M.S. Swaminathan School of Agriculture in Paralakhemundi, Gajapati, Odisha, using a compact family block design with two replications.
The study assessed six populations (P1, P2, F1, F2, BCP1, and BCP2) from two elite hybrid combinations, (CML138 [P1] × CML145 [P2]) and (CML334 [P1] × CML330 [P2]), which showed the highest values in terms of yield-related traits. The parental lines, F1 hybrids, F2 populations, and backcrosses were randomized separately in each replication. The P1, P2, and F1 populations were planted in a single row of 10 plants each, whereas the BCP1 and BCP2 populations were planted in two rows of 20 plants each. The F2 populations consisted of 25 rows, each containing a total of 250 plants. Planting was done at a spacing of 60 cm × 20 cm.
“Observations were taken at the plot level, recording the number of days until half of the plants displayed tassels and silks, which was measured from the time of planting to this point. Besides that, we measured the plant’s height in centimeters, the ears’ length in centimeters, their height in centimeters, their girth in centimeters, the kernels’ density per row and per cob, the 100-grain weight in grams, and the grain yield per plant in grams. An infrared thermal meter was used to record the canopy temperature in degrees Celsius, and a SPAD502 chlorophyll meter was used to measure the chlorophyll content in percentage. Using procedures described by Premachandra et al. [4], the membrane stability index (%) was determined from fresh leaf samples. Soxhlet extraction was used to measure the oil content (%), and the Lowry technique was used to analyze the protein content (%) in the grains. Catalase (U mL−1) and peroxidase (U mL−1) activities were measured on fresh leaf samples using a Labman ultra-violet visible spectrophotometer (LMSP-UV1900), as described by Sadasivam et al. [5]. Visual assessments were made for leaf firing, tassel blast, and root lodging (%). Data were collected from 10 plants for the parental and F1 populations, 20 plants for the backcross populations, and 250 plants for the F2 populations [6].
The GMA analysis was carried out for pearl millet in accordance with the methods provided by Pujar et al. [7]. Using a six-parameter model that accounts for additive and non-additive genetic effects, the data were used to determine which genes had the most impact on maize.
2.3. Statistical Analysis
2.3.1. GMA
Genetic parameter estimates and epistatic interaction evaluations were carried out using the GMA six-parameter model. This model was used to assess traits that varied significantly (P ≤ 0.05) between populations. Analysis of variance was applied to the data to assess generational differences. Initial testing for epistatic interactions was performed on the mean data using individual scaling tests A, B, C, and D as proposed by Mather [8]. “
Scale A = 2BCP1−P1−F1
Scale B = 2BCP2−P2−F1
Scale C = 4F2−2F1−P1−P2
Scale D = 2F2−BCP1−BCP2
In this analysis, P1, P2, F1, F2, BCP1, and BCP2denote the means from various generations. The variances for A, B, C, and D were calculated using the corresponding variances from the different populations, as outlined below:
VA = 4V (BCP1)+V (P1)+V (F1)
VB = 4V (BCP2)+V (P2)+V (F1)
VC = 16V (F2)+4V (F1)+V (P1)+V(P2)
VD = 4V (F2)+V (BCP1)+V (BCP2)
In this analysis, VA, VB, VC, and VD represent the variances for scales A, B, C, and D, respectively. VP1, VP2, VF1, VF2, VBCP1, and VBCP2 are the variances for the P1, P2, F1, F2, BCP1, and BCP2 populations. The standard errors for scales A, B, C, and D were determined by taking the square root of their respective variances. We used a t-test to see how far we got from the zero-point scenario. At the 5% and 1% significance levels, with the necessary degrees of freedom, the computed t-values were compared to the values in the “t” table.”
Following Hayman’s [9] recommendation, we fitted the data into a six-parameter model for GMA to evaluate the genetic influences, if any, of the scaling tests that yielded significant findings. This model was used to estimate genetic parameters, such as mean (m), additive gene effects (d), dominance gene effects (h), and three types of epistasis: additive × additive (i), additive × dominance (j), and dominance × dominance (l). The estimation of these parameters was performed using the following formula: “
m = Mean = F2
d = Additive effect = BCP1−BCP2
h = Dominance effect = F1−4F2−(1/2) P1−(1/2) P2 +2BCP1+2BCP2
l = Dominance × Dominance effect = P1+P2+2F1+4F2−4BCP1−4BCP2
Where,
The genetic effect variances were determined using the following formula:
Vm = V (F2)
Vd = V (BCP1)+V (BCP2)
Vh = V (F1) +16V (F2)+(1/4) V (P1)+(1/4) V (P2) +4V (BCP1)+4V (BCP2)
Vi = 4V (BCP1)+4V (BCP2)+16V (F2)
In this analysis, V(P1), V(P2), V(F1), V(F2), V(BCP1), and V(BCP2) represent the variances for the P1, P2, F1, F2, BCP1, and BCP2 populations, respectively. The significance of the genetic parameters was evaluated using the t-test. To accomplish this, the standard error for each component was initially determined by taking the square root of its respective variance. The significance of the genetic effects was then assessed using the t-test, a similar approach to that used for the scaling tests.
To understand the nature of epistasis, estimating dominance (h) and dominance × dominance (l) effects, along with their signs, was crucial. Mather and Jinks [10] said that gene actions were considered complementary when the signs of h and l were the same, and duplicating when the signs were opposite.
The procedure outlined by Robinson et al. [11] was followed to compute the degree of dominance, which is the square root of the ratio of dominance variance (h) to additive variance (d).
3. RESULTS AND DISCUSSION
The genetic regulation of morphological and biochemical traits across all crosses may be better understood with the use of GMA. Crucial to comprehending the inheritance of traits, this method separates genetic influences into additive, dominant, and epistatic components. Notable dominance effects in maize were noted by Sharma et al. [12].
There are notable differences (P < 0.05) in GMA for different qualities across different groups. Differences between populations are highlighted through the analysis of variance. Mean performance of six populations (P1, P2, F1, F2, BCP1, and BCP2), along with the scaling tests (A, B, C, and D), and the genetic parameters (m, d, h, i, j, and l) were calculated for the two QPM crosses, CML138 × CML145 and CML334 × CML330, using the six-parameter model.
3.1. Mean Analysis
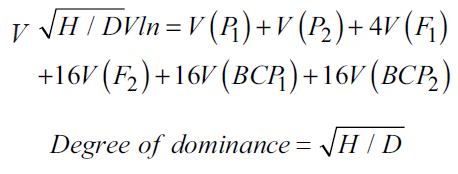
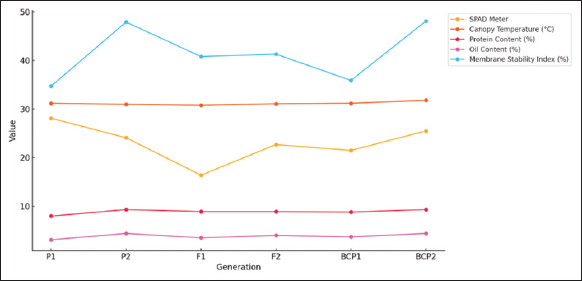
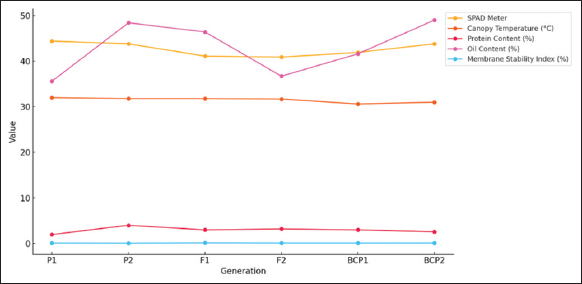
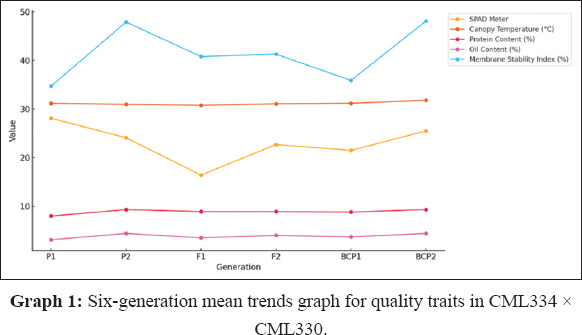
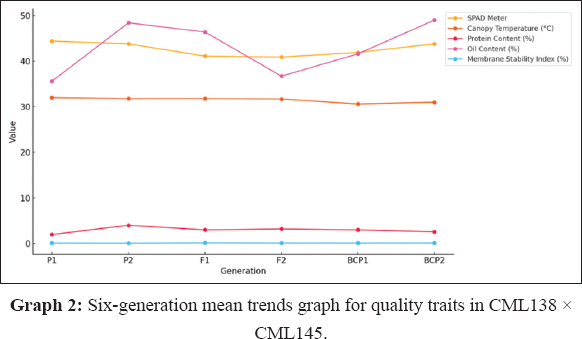
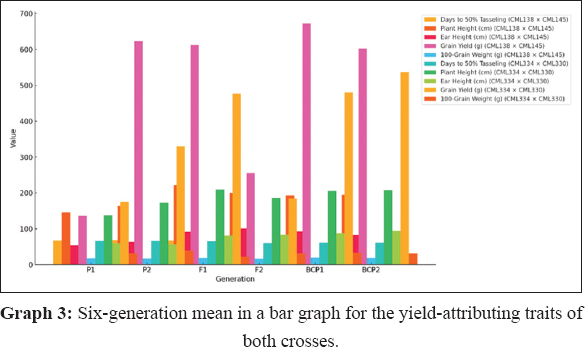
GMA involves evaluating populations (P1, P2, F1, F2, BCP1, and BCP2) from a cross to assess gene action for specific traits. In this study, the mean values of six populations from two crosses, (CML138 [P1] × CML145 [P2]) and (CML334 [P1] × CML330 [P2]), were analyzed across 21 traits. The results indicated that for the cross (CML138 × CML145), the F1 mean values were higher than those of both parents for all characteristics studied, except for days to 50% tasseling, days to 50% silking, anthesis-silking interval, number of kernel rows per cob, chlorophyll content (%), canopy temperature (°C), protein content (%), oil content (%), peroxidase activity (U mL−1), leaf firing (%), and tassel blast score (Tables 1 and 2; Figures 1 and 2). In the cross (CML334 × CML330), the F1 means exceeded both parents only for traits such as plant height (cm), cob height (cm), cob length (cm), number of kernels per row, number of kernel rows per cob, grain yield per plant (g), catalase activity (U mL−1), and root lodging (%), as shown in (Tables 3 and 4) and (Figure 3). The six-generation trend for quality traits in CML138 × CML145 is depicted in Graph 2. These two crosses exhibited different responses with respect to the evaluated traits. In addition, it was observed that the (CML138 × CML145) cross demonstrated superior heterotic performance in terms of grain yield per plant compared to the (CML334 × CML330) cross. The six-generation trend for quality traits in CML334 × CML330 is illustrated in Graph 1. The superior performance of the F1 population over the parental and segregating generations suggests a predominance of epistasis specifically for grain yield per plant, plant height, cob height, anthesis–silking interval, and number of kernel rows per cob, which was earlier reported by Elmyhun et al. [13] and Sharma et al. [12]. The yield-attributing traits for both crosses across six generations are shown in Graph 3.
Table 1: Generation means for yield attributes in six generations of CML138×CML145.
Genotype
Days to 50% tasseling (days)
Days to 50% silking (days)
Anthesis-silking interval (days)
Plant height (cm)
Ear height (cm)
Ear length (cm)
Number of kernels row-1
Number of kernel rows cob-1
Ear girth (cm)
Grain yield plant-1 (g)
100 grain weight (g)
CML138 (P1)
67.2
69.40
2.2
145.60
54.00
9.7
12.40
11.00
8.9
136.80
17.8
CML145 (P2)
68.4
69.8
1.4
164.4
62.8
20.0
34.8
17.4
11.0
622.8
17.2
CML138×CML145 (F1)
66.8
68.6
1.8
221.2
91.4
21.6
35.2
17.2
11.2
612.4
18.8
CML138×CML145 (F2)
60.8
62.7
2.0
200.0
100.8
17.4
17.6
14.4
8.9
255.7
16.4
(CML138×CML145 [CML138]) (BCP1)
59.8
62.8
3.0
192.8
92.8
21.4
39.0
17.2
11.2
671.6
19.8
(CML138×CML145 [CML145]) (BCP2)
59.8
62.8
3.0
194.4
83.0
19.8
35.6
16.8
11.4
602.4
19.0
Mean
63.8
66.02
2.23
186.4
80.8
18.32
29.1
15.67
10.43
483.62
18.17
SEM
1.66
1.46
0.27
11.03
7.54
1.83
4.55
1.04
0.49
92.67
0.51
Table 2: Generation means for quality attributes in six generations of CML138×CML145.
Genotypes
SPAD meter chlorophyll content (%)
Canopy temperature (°C)
Protein content %
Oil content%
Membrane stability index (%)
Catalase (U mL−1)
Peroxidase (U mL−1)
Leaf firing (score)
Tassel blast (score)
Root lodging (%)
CML138 (P1)
44.4
32.0
7.1
2.0
35.6
0.104
0.282
0.6
0.6
0.6
CML145 (P2)
43.8
31.8
8.9
4.0
48.4
0.079
0.335
0.4
0.4
0.2
CML138×CML145 (F1)
41.1
31.8
8.0
3.0
46.4
0.144
0.327
0.4
0.4
0.8
CML138×CML145 (F2)
40.9
31.7
8.2
3.2
36.7
0.111
0.334
0.2
0.2
0.3
(CML138×CML145 [CML138]) (BCP1)
41.9
30.6
7.3
3.0
41.6
0.109
0.379
0.2
0.2
0.0
(CML138×CML145 [CML145]) (BCP2)
43.8
31.0
8.9
2.6
49.0
0.117
0.364
0.2
0.2
0.0
Mean
42.65
31.48
8.07
2.97
42.95
0.111
0.337
0.33
0.33
0.32
SEM
0.68
0.22
0.24
0.29
2.11
0.01
0.013
0.06
0.06
0.11
Table 3: Generation means for yield attributes in six generations of CML334×CML330.
Genotype
Days to 50% tasseling (days)
Days to 50% silking (days)
Anthesis-silking interval (days)
Plant height (cm)
Ear height (cm)
Ear length (cm)
No. of kernels row-1
No. of kernel rows cob-1
Ear girth (cm)
Grain yield plant-1 (g)
100 grain weight (g)
CML334 (P1)
65.80
69.80
4.0
137.80
60.2
13.50
13.80
12.60
9.1
175.60
31.96
CML330 (P2)
65.6
68.4
2.8
172.6
56.2
16.7
22.8
14.4
9.8
330.0
38.3
CML334×CML330 (F1)
65.4
67.2
1.8
208.8
81.2
18.2
29.8
16.0
9.0
476.8
23.0
CML334×CML330 (F2)
60.5
62.5
2.1
186.1
83.1
16.4
13.5
13.6
8.7
184.4
31.4
(CML334×CML330 [CML334]) BCP1
60.8
63.8
3.0
204.8
87.8
14.6
31.6
15.2
7.2
480.0
33.8
(CML334×CML330 [CML330]) BCP2
61.0
64.0
3.0
207.4
94.0
12.6
32.0
17.0
7.8
536.8
31.0
Mean
63.85
65.78
2.78
186.58
77.08
15.33
23.28
14.3
8.43
363.93
31.91
SEM
1.06
1.13
0.36
10.68
6.19
0.91
3.63
0.68
0.39
57.91
2.05
Table 4: Generation means for quality attributes in six generations of CML334×CML330.
Genotype
SPAD meter
Canopy temperature (°C)
Protein content %
Oil content%
Membrane stability index (%)
Catalase (U mL−1)
Perioxidase (U mL−1)
Leaf firing (score)
Tassel blast (score)
Root lodging (%)
CML334 (P1)
28.1
31.20
8.0
3.1
34.72
0.100
0.260
0.4
0.4
0.2
CML330 (P2)
24.1
31.0
9.3
4.4
47.9
0.120
0.440
0.2
0.2
0.2
CML334×CML330 (F1)
16.4
30.8
8.9
3.5
40.8
0.200
0.260
0.2
0.2
0.4
CML334×CML330 (F2)
22.7
31.1
8.9
4.0
41.3
0.126
0.251
0.1
0.1
0.1
(CML334×CML330 [CML334]) BCP1
21.5
31.2
8.8
3.7
35.9
0.140
0.220
0.2
0.2
0.4
(CML334×CML330 [CML330]) BCP2
25.5
31.8
9.3
4.4
48.1
0.120
0.260
0.2
0.2
0.4
Mean
23.05
31.18
8.87
3.85
41.79
0.134
0.282
0.22
0.22
0.32
SEM
1.68
0.14
0.22
0.23
2.31
0.013
0.031
0.04
0.04
0.05
Figure 1: Six-generation mean trends graph for quality traits in CML334 × CML330.
3.2. Assessment of Genetic Components for Biochemical, Grain Yield, and its Attributing Traits
Several traits in both crosses did not fit the basic additive–dominance model, as revealed by the scaling test. In the CML138 × CML145 cross, the model was found to be insufficient for ASI, plant height (cm), 100-grain weight (g), chlorophyll content (%), protein content (%), catalase, peroxidase, and root lodging (%). In the CML334 × CML330 cross, the model was also inadequate for cob length (cm), 100-grain weight (g), chlorophyll content (%), protein content (%), catalase, peroxidase, and leaf firing (%). The GMA corroborated these findings, which pointed to the existence of epistasis.”
“In this study, a duplicate type of epistasis was observed in both crosses (CML138 × CML145 and CML334 × CML330) for traits such as days to 50% silking, ASI, cob length (cm), number of kernels per row, number of kernel rows per cob, cob girth (cm), grain yield per plant, canopy temperature, protein content, oil content, membrane stability index, peroxidase activity, leaf firing, tassel blast, and root lodging (Table 5). In addition, the epistasis in the CML334 × CML330 cross was found to be of the complementary type for traits such as days to 50% tasseling, 100-grain weight, chlorophyll content, and catalase. Traits such as plant height, cob height, and catalase exhibited complementary epistasis in the CML138 × CML145 cross (Table 5).
Table 5: Estimates of different scaling tests and genetic effects for quantitative and qualitative parameters in two quality protein maize crosses.
Significant at P=0.05% level, Significant at P=0.01% level
The anthesis-silking interval is expressed by both dominance and epistatic interactions (i and l), which have significant magnitudes in the CML334 × CML330 cross. These effects are additive × additive and dominant × dominant, respectively. Dominance effect (h) prevailing over the additive effect (d) suggests that dominant gene action influences the inheritance of these traits. In addition, the opposite signs of the parameters (h) and (l) imply the involvement of duplicate epistasis in the inheritance of traits in both the CML138 × CML145 and CML334 × CML330 crosses. These findings are consistent with those of Shankar et al. [14] in maize cross populations.
Dominance and epistatic interactions (additive × additive and dominant × dominant) appear to be crucial in the inheritance of plant height and cob height in the CML334 × CML330 cross, as indicated by the significant dominance (h) effect and the interaction effects i (additive × additive) and l (dominant × dominant). For plant height, the dominance effect was more pronounced. The CML334 × CML330 cross showed duplicate epistasis, whereas the CML138 ×CML145 cross showed complementary epistasis. The (h) and (l) effects were also flowing in the same direction, as shown in Table 5. Similar trends were found for cob height, where the opposite signs of gene effects (h) and (l) in the CML334 × CML330 cross suggest duplicate epistasis, and complementary epistasis was again observed in the CML138×CML145 cross (Table 5). These findings on dominance and non-additive gene action for both traits align with those of [15,16], who reported duplicate gene action for plant height, cob height, and yield-related traits in maize. The opposite signs of the gene effects (h) and (l) suggest that duplicate epistasis occurs in both crosses in cob length (Table 5). These results align with findings on dominance and epistatic gene action in maize by Murugesan et al. [17].
Both the number of kernels per row and the number of kernel rows per cob are critical factors that influence grain yield per plant in maize [4]. In the case of the number of kernels per row, the significant dominance (h) effect, along with the interaction effects i (additive × additive) and l (dominant × dominant) in both crosses, and the significant magnitude of j (additive × dominant) in the CML138 × CML145 cross, suggest that dominance and epistatic gene actions play significant roles in the inheritance of this trait. Duplicate epistasis was observed in both crosses (Table 5), consistent with the findings of [3,14,18], who reported duplicate gene interactions for this trait in maize. Similarly, for the number of kernel rows per cob, the significant dominance (h) effect, along with the interaction effects i (additive × additive), j (additive × dominant), and l (dominant × dominant) in both crosses, indicates that dominance and epistatic interactions are key factors in determining this trait. Duplicate epistatic interactions were observed in both crosses (Table 5), aligning with the results of Rahangdale et al. [19] and Nagarajan et al. [20] in maize.
For grain yield per plant, the significant dominance (h) effect, along with interaction effects i (additive × additive) and l (dominant × dominant) in both crosses, and the significant magnitude of j (additive × dominant) in the CML138 × CML145 cross, suggest that dominance and epistasis play a crucial role in the inheritance of this trait. Duplicate epistasis was observed in both crosses, supporting the findings of Chiangmai et al. [21] and Sharma et al. [12], who also identified non-additive gene effects influencing grain yield in maize. In 100 grain weights, a duplicate type of epistatic interaction was observed in the CML138 × CML145 cross, while complementary epistasis was found in the CML334 × CML330 cross (Table 5). These results align with those of Moharramnejad et al. [22], who reported non-additive gene effects influencing 100-grain weight in maize.
Chlorophyll content directly correlates with photosynthetic efficiency and ultimately grain yield [23]. In the CML138 × CML145 cross, duplicate epistasis was observed for chlorophyll content, while complementary epistasis was noted in CML334 × CML330 (Table 5). Solangi et al. [24] found duplicate gene action for chlorophyll content in wheat, and Moharramnejad et al. [22] observed non-additive gene effects for this trait in maize.
Canopy temperature exhibited significant dominance (h) effects, along with interaction effects i (additive × additive) and l (dominant × dominant) in both crosses, suggesting that both dominance and epistasis are important for this trait. Duplicate epistasis was observed in both crosses. These findings align with Jayalakshmi and Reddy [25] and Premachandra et al. [4], which highlighted the role of non-additive gene effects in QPM.
In the membrane stability index (MSI), significant additive (d) components were observed in both crosses, along with a significant j (additive × dominant) effect in CML334 × CML330. The gene effects (h), (i), and (l) were significant in CML138 × CML145, indicating non-additive interactions. Duplicate epistasis was observed in both crosses, consistent with Abid et al. [26] and Moharramnejad et al [22] also reported non-additive gene effects for this trait in maize. Together, these results emphasize the importance of both additive and non-additive gene effects in the inheritance of these traits, which play a crucial role in maize’s stress resilience and productivity.
Catalase activity, which contributes to antioxidant capacity in high-yielding QPM lines, was found to exhibit complementary epistasis in both CML138 × CML145 and CML334 × CML330 (Table 5). Non-additive gene effects for catalase activity in maize leaf samples support the role of non-additive gene effects in this trait. A duplicate type of epistasis was observed for peroxidase activity in both crosses. Non-additive gene effects for this trait in maize leaf samples for peroxidase. Duplicate epistatic interactions were observed for protein and oil content in both crosses. Sharma et al. [12] previously reported non-additive gene effects for both traits in maize.
A duplicate type of epistasis interaction was observed for leaf firing, tassel blast, and root lodging in both CML138 × CML145 and CML334 × CML330 crosses, indicating the involvement of gene interactions where another gene masks one gene’s effect at different loci. These findings align with those of Raj et al. [6], who noted non-additive gene effects for heat tolerance traits, such as leaf firing and tassel blast, in QPM. Overall, the observed dominance and epistatic interactions for these traits are presented in detail in Table 5.
3.3. Degree of Dominance
The degree of dominance in the two crosses showed significant variation. In the CML138 × CML145 cross, the degree ranged from -7.3987 for cob girth (cm) to 5.7671 for the number of kernel rows per cob. Similarly, in the CML334 × CML330 cross, the degree of dominance varied from −14.5599 for the number of kernels per row to 3.8184 for the ASI. Notably, the number of kernel rows per cob in the CML138 × CML145 cross showed a higher degree of dominance (5.7671), indicating considerable non-additive genetic effects, which aligns with findings by Patil et al. [27].
For the majority of characteristics, such as times to 50% silking, ear girth, ASI, cob length, protein content, leaf firing, tassel blast, canopy temperature, oil content, membrane stability index, peroxidase activity, root lodging, and days to 50% silking. Duplicate gene activity was detected in both crossings, suggesting that dominant effects governed the inheritance. As pointed out by Dinesh et al. [28] in the case of cowpea, this suggests that selecting plants based on their genetic diversity may lead to substantial genetic improvements and enhanced resistance to various types of environmental stress.
Traits exhibiting complementary gene action in one or both crosses, such as catalase activity, days to 50% tasseling, plant height, cob height, 100-grain weight, and chlorophyll content, should be focused on for genetic gain. Assessing the genetic potential of selected plants for improved population performance and selection intensity could yield better results compared to traits governed by duplicate gene interactions, as previously observed by Rahimi Jahangirlou et al. [29].
4. CONCLUSIONS
When examining the inheritance of most features, the GMA revealed that the dominance gene effect and epistatic interactions (double gene activity) were the dominant factors. This provided vital insights into how traits are genetically controlled. To build efficient breeding programs and understand the genetic basis of trait inheritance, this data is vital. There may be chances to take advantage of heterosis through the dominant gene effect and dominance × dominance interactions. Furthermore, it was noted that both crosses showed signs of additive × additive effects, suggesting that there may be selection benefits. Duplicate gene action for traits like days to 50% silking, ear girth, ASI, cob length, protein content, leaf firing, tassel blast, canopy temperature, oil content, membrane stability index, peroxidase activity, and root lodging is likely due to the substantial role of dominance and dominance × dominance effects in both combinations. Hence, regulating populations that are segregating and severing undesired links may be effectively achieved through biparental mating.
5. ACKNOWLEDGMENT
Financial assistance and technical assistance by the Department of Genetics and Plant Breeding, M.S. Swaminathan School of Agriculture, CUTM, are duly acknowledged.
6. AUTHORS’ CONTRIBUTIONS
All authors made substantial contributions to conception and design, acquisition of data, or analysis and interpretation of data; took part in drafting the article or revising it critically for important intellectual content; agreed to submit to the current journal; gave final approval of the version to be published; and to be accountable for all aspects of the work. All the authors are eligible to be author as per the International Committee of Medical Journal Editors (ICMJE) requirements/guidelines.
7. CONFLICTS OF INTEREST
The authors report no financial or any other conflicts of interest in this work.
8. ETHICAL APPROVALS
This study does not involve experiments on animals or human subjects.
9. DATA AVAILABILITY
All the data is available with the authors and shall be provided upon request.
10. PUBLISHER’S NOTE
All claims expressed in this article are solely those of the authors and do not necessarily represent those of the publisher, the editors and the reviewers. This journal remains neutral with regard to jurisdictional claims in published institutional affiliation.
11. USE OF ARTIFICIAL INTELLIGENCE (AI)-ASSISTED TECHNOLOGY
The authors declare that they have not used artificial intelligence (AI)-tools for writing and editing of the manuscript, and no images were manipulated using AI.
REFERENCES
1. Vidadala R, Kumar V, Rout S, Sil P, Teja V, Rahimi M. Genetic analysis of quality protein maize (QPM):A review. Cereal Res Commun. 2024;53:1-9.[CrossRef]
2. Ayyanna B, Bhat JS, Rakshith P, Kariyannanavar P. Heterosis and combining ability analysis in newly developed inbred lines of maize (Zea mays L.). Pharma Innov J. 2023;12(11):1356-62.
3. Attri H, Dey T, Singh B, Kour A. Genetic estimation of grain yield and its attributes in three wheat (Triticum aestivum L.) crosses using six-parameter model. J Genet. 2021;100:47.[CrossRef]
4. Premachandra GS, Saneoka H, Fujita K, Ogata S. Cell membrane stability and leaf water relations as affected by phosphorus nutrition under water stress in maize. Soil Sci Plant Nutr. 1990;36(4):661-6.[CrossRef]
5. Sadasivam S, Manickam A. Carbohydrates. In: Sadasivam S, Manickam A, editors. Methods in Biochemistry. New Delhi: New Age International Pvt. Ltd.;1996. 11-2.
6. Raj GS, Marker S, Scaria S, Ansari SM. Quantitative studies on heterosis and inbreeding depression in quality protein maize for terminal heat tolerance. J Pharmacogn Phytochem. 2020;9(2):784-8.
7. Pujar M, Govindaraj M, Gangaprasad S, Kanatti A, Gowda TH, Kumar BM. Generation mean analysis reveals the predominant gene effects for grain iron and zinc contents in pearl millet. Front Plant Sci. 2022;12:693680.[CrossRef]
8. Mather K. Biometrical Genetics: The study of Continuous Variation. London: Metuen and Co. Limited;1949.
9. Hayman BI. The separation of epistasis from additive and dominance variation in generation means. Heredity. 1958;12:371-90.[CrossRef]
10. Mather K, Jinks JL. Biometrical Genetics. London:Chapman and Hall;1971.[CrossRef]
11. Robinson HF, Comstock RE, Harvey PH. Estimates of heritability and degree of dominance in corn. Agron J. 1949;41(6):253-9.[CrossRef]
12. Sharma P, Singh N, Kamboj MC, Kumar R. Understanding the genetics of important quality traits in maize (Zea mays L.) diverse germplasm by generation mean analysis. Agric Assoc Text Chem Crit Rev. 2023;11(4):1-2. [CrossRef]
13. Elmyhun M, Abate E, Abate A, Teklewold A, Menkir A. Genetic analysis of tolerance to combined drought and heat stress in tropical maize. PLoS One. 2024;19(6):0302272.[CrossRef]
14. Shankar M, Singh R, Shahi JP, Devesh P, Singh P. Generation mean analysis for yield and drought related traits in maize (Zea mays L.). Curr J Appl Sci Technol. 2022;41(22):30-45.[CrossRef]
15. Haq MI, Ajmal S, Kamal N, Khanum S, Siddique M, Kiani MZ. Generation mean analysis for grain yield in maize. Generations. 2013;1(13):11-38.
16. Dorri P, Khorasani SK, Shahrokhi M. Generation means analysis:A case study of variance components in KSC 500 generations of maize (Zea mays L.). Int Res J Appl Basic Sci. 2014;8(2):194-200.
17. Murugesan T, Dharmalingam K, Venkatesan T, Jegadeesan S, Palaniappan J. Generation mean analysis for seed yield and its contributing traits in the inter-varietal cross of blackgram (Vigna mungo (L.) Hepper). Agric Sci Dig. 2024;44(4):720-4.[CrossRef]
18. Sharma P, Kamboj MC, Singh N, Kumar R, Naveen K. Generation mean analysis in maize (Zea mays L.) yields and yield attributing traits. Indian J Agric Sci. 2022;92(1):110-7.[CrossRef]
20. Nagarajan D, Thiyagarajan K, Murugan E. Inheritance studies through generation mean analysis for quantitative traits in soybean (Glycine max (L.) Merrill.). J Appl Nat Sci. 2022;14(SI):111-8.[CrossRef]
21. Chiangmai PN, Yodmingkhwan P, Nilprapruck P, Aekatasanawan C, Kanjanamaneesathian M. Generation means analysis of phytic acid and inorganic phosphorus contents in corn (Zea mays L.). Maydica. 2013;58:243-53.
22. Moharramnejad S, Valizadeh M, Emaratpardaz J. Generation mean analysis in maize (Zea maysL.) drought stress. Fresenius Environ Bull. 2018;27(4):2518-22.
23. Li W, Pan K, Liu W, Xiao W, Ni S, Shi P, et al. Monitoring maize canopy chlorophyll content throughout the growth stages based on UAV MS and RGB feature fusion. Agriculture. 2024;14(8):1265.[CrossRef]
24. Solangi AH, Lakho SK, Jatoi WA, Solangi N, Solangi A, Syed Q, Syed MH. Heterosis and combining ability for phenological yield and fiber traits of cotton (Gossypium hirsutum L.). Plant Sci. Today. 2024;11(3):213-29.[CrossRef]
25. Jayalakshmi V, Reddy LG. Generation mean analysis for certain quantitative characters in groundnut. Agric Sci Dig. 2024;23(4):255-8.
26. Abid M, Ali S, Qi LK. Physiological and biochemical changes during drought and recovery periods at tillering and jointing stages in wheat (Triticum aestivum L.). Sci Rep. 2018;8:4615.[CrossRef]
27. Patil KH, Mahajan RC, Nagargoje VT. Generation mean analysis in maize (Zea mays L.). J Oilseeds Res. 2020;37:120-8.[CrossRef]
28. Dinesh HB, Viswanatha KP, Lohithaswa H, Pavan R, Singh P. Genetic association estimates using third and fourth-degree statistics in early segregating generations of cowpea. Int J Curr Microbiol Appl Sci. 2018;7(1):894-9. [CrossRef]
29. Rahimi Jahangirlou M, Akbari GA, Alahdadi I. Phenotypic traits, grain yield and yield components of maize cultivars under combinations of management practices in semi-arid conditions of Iran. Int J Plant Prod. 2021;15:459-71.[CrossRef]