1. INTRODUCTION
Bioenergy constitutes a crucial category of renewable energy obtained from biological substances, including but not limited to wood, animal waste, straw, and an array of agricultural by-products [1]. It is considered one of the most feasible short to medium strategies for mitigating greenhouse gas emissions and substituting traditional fossil fuels. The increasing global energy demand and mounting environmental concerns associated with fossil fuel consumption have intensified the search for sustainable and clean energy alternatives [2]. Among the diverse spectrum of renewable energy sources, biomethane has surfaced as a noteworthy biofuel owing to its elevated energy density and its congruity with the pre-existing natural gas infrastructure [3]. Anaerobic digestion (AD), a microbial process that breaks down organic matter to produce biogas, mainly methane and carbon dioxide, has been increasingly adopted in recent years [4,5]. Conventionally used for agricultural and municipal waste treatment, the scope of AD has expanded to include complex and energy-dense feedstocks. One such unconventional yet underexplored feedstock is petroleum coke (pet coke), a carbon-rich byproduct of oil refining that presents both a disposal challenge and an opportunity for bioenergy valorization [6].
Pet coke is characterized by its high calorific value and carbon content but poses substantial barriers to microbial degradation due to its low biodegradability, aromatic structure, and high sulfur content [7]. To circumvent these limitations, biological pre-treatment and enhancement strategies, such as the incorporation of specialized microbial consortia and functional nanomaterials, have been recently explored. In particular, microbial consortia derived from coal mine environments have shown unique metabolic adaptability and resilience under harsh conditions, making them ideal inocula for tackling recalcitrant carbonaceous substrates, such as pet coke [8,9]. These microbial communities often possess anaerobic hydrocarbon degrading capabilities that can facilitate the breakdown of pet coke components into intermediate compounds suitable for methanogenesis.
Furthermore, the incorporation of magnetic iron oxide nanoparticles (NPs) into the AD system introduces a novel approach to improving process efficiency [10]. These NPs have the capacity to augment microbial activity through the facilitation of electron transfer, the enhancement of enzyme accessibility, and the potential reduction of toxic intermediates [11]. Their magnetic attributes also allow for easier recovery and recycling, adding a layer of economic and environmental sustainability. So also, the utilization of magnetic Fe2O3 NPs to improve AD of pet coke represents a novel approach, as the interaction between iron-based nanocatalysts and a resistant carbon-rich substrate has not been thoroughly explored. However, despite their potential of these enhancements, the synergistic effects of biomass concentration, inoculum size, and NP dosage remain largely unoptimized and poorly understood.
To systematically investigate and optimize these critical parameters, this research employs Response Surface Methodology (RSM), a robust statistical and mathematical tool used for modeling and analyzing problems in which multiple variables influence the desired response. RSM facilitates the development of empirical models that can predict biomethane yield under various operational conditions and identify optimal combinations of the input variables [12]. This methodology not only augments the efficacy of the experimental framework by diminishing the quantity of necessary trials but also elucidates the interactive influences among variables, which are frequently neglected in conventional one-factor-at-a-time approaches [13,14].
The objective of this study is to optimize biomethane production from pet coke using AD, with a specific focus on three key variables: Biomass (pet coke) concentration, inoculum size (coal mine microbial consortium), and magnetic Fe2O3 NPs concentration. Across the application of RSM, the study aims to maximize methane yield. This research not only contributes to advancing sustainable biofuel production from industrial residues but also offers a strategic framework for integrating novel materials and microbial consortia into AD systems. In addition, the successful optimization of such a system could pave the way for valorizing pet coke waste streams, reducing environmental burdens, and creating a feasible pathway for decentralized renewable energy generation.
2. MATERIALS AND METHODS
2.1. Materials
2.1.1. Chemicals
All chemicals used in this work were of analytical grade, purchased from Sisco Research Laboratories Pvt. India and used as received without further purification.
2.1.2. Feedstock
Petroleum coke (pet coke) used in this study was sourced from Chennai Petroleum Corporation Limited (CPCL), Chennai, Tamil Nadu, India. The material was ground and sieved to a uniform particle size (<250 μm) to attain homogeneity and improve surface area for microbial action. A preliminary hydrogen sulfide (H2S) screening test was conducted to assess potential inhibition by the feedstock. The pet coke was also characterized before use for key parameters, including elemental composition (C, H, S, N, and O), moisture content, and ash content using standard methods (ASTM D3176 and D5865). All parameters were analyzed in triplicate, and mean ± SD was calculated.
2.1.3. Microbial inoculum
The microbial inoculum was procured from anaerobic sludge sampled from coal mine effluent sedimentation tanks in Telangana district (Coordinates: 17.20613, 80.79979). The microbial community was enriched under strictly anaerobic conditions for three weeks in a basal mineral medium supplemented with coal-derived organics to promote the proliferation of hydrocarbon-degrading anaerobes.
2.1.4. Magnetic iron oxide (Fe2O3) NPs
Magnetic Iron oxide (Fe2O3) NPs were synthesized through coprecipitation of ferrous and ferric salts in an alkaline environment, followed by functionalization with ionic liquids comprising biocompatible cations and anions, as elucidated by [15,16]. The NPs were characterized using scanning electron microscopy (SEM) and X-ray diffraction (XRD) recorded using a PANlytical X’Pert PRO Diffractometer with Kα radiation (λ = 1.5406 Å), to confirm morphology, crystalline structure, and surface functionality. The NPs were added in varying dosages (mg/L) based on experimental design.
2.2. Fermentation Experiments and Analytical Methods
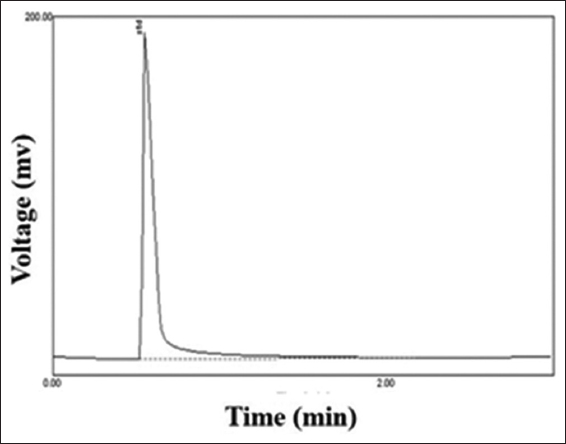
Batch AD experiments were conducted using a 500 mL Erlenmeyer flask with a working volume of 400 mL. Each bottle was loaded with the required amount of pet coke, inoculum, and NPs as per the experimental design (Figure 1). The medium was adjusted to a pH of 7.0 ± 0.2 and subjected to nitrogen gas purging for 10 min to ensure anaerobic conditions; all reactors were maintained at 37 ± 1°C for 30 days in a controlled shaker (100 rpm), with controls lacking pet coke, inoculum, or NPs to assess baseline methane production. Biogas production was monitored daily by the water displacement method. The methane concentration within the biogas was analyzed through gas chromatography (GC) (HP-PLOT Q (30 m × 0.32 mm, 20 μm film, Helium at 1.2 mL/min) integrated with a thermal conductivity detector alongside a stainless-steel packed column. The calibration was performed using standard gas mixtures with R2 > 0.995.
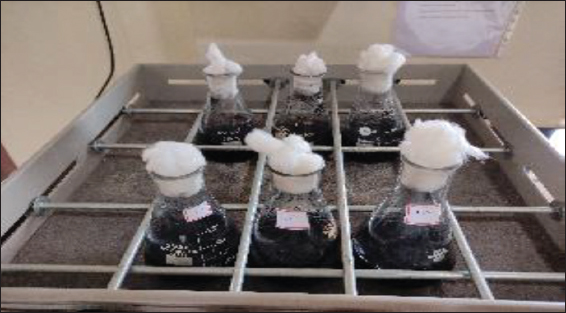 | Figure 1: Digital photos showing parts of sample during biomethane production experiment.
[Click here to view] |
2.3. Experimental Design and Statistical Analysis
A central composite design based on a two-level factorial structure was employed to optimize the process parameters affecting biomethane yield. The independent variables selected were pet coke concentration (A: 4–10g/L), inoculum size (B: 5–8% (v/v)), and magnetic Fe2O3 NPs dosage (C: 10–40 mg/L), which are shown in Table 1. The ranges were determined based on preliminary experiments, ensure optimal biomethane yield. The dependent variable (response) was cumulative methane production (CH4 %). Design-Expert software (version 13) was used for the design matrix generation, regression analysis, and response surface modeling. The respective variables are shown in Table 1, while the generated experimental designed with predicted and actual response are shown in Table 2.
Table 1: Independent-dependent variables and limit values.
| Name | Unit | Type | Standard deviation | Minimum | Maximum |
|---|
| Pet coke | g/L | Independent | 0 | 4 | 10 |
| Inoculum size | %(v/v) | Independent | 0 | 2 | 8 |
| Magnetic iron oxide nanoparticles | mg/L | Independent | 0 | 10 | 40 |
Table 2: Experimental design for RSM.
| Standard | Run | Factor 1: Pet coke (A) (g/L) | Factor 2: Inoculum size %(v/v) | Factor 3: Magnetic Fe2O3 NPs (mg/L) | Actual response: Biomethane (%) | Predicted response values (%) |
|---|
| 7 | 1 | 4 | 8 | 40 | 27.8 | 25.2 |
| 9 | 2 | 6 | 6 | 25 | 26.4 | 20.9 |
| 6 | 3 | 8 | 4 | 40 | 32.6 | 28.4 |
| 12 | 4 | 6 | 6 | 25 | 25.3 | 20.9 |
| 4 | 5 | 8 | 8 | 10 | 18.7 | 21.5 |
| 8 | 6 | 8 | 8 | 40 | 32.1 | 33.3 |
| 1 | 7 | 4 | 4 | 10 | 16.3 | 8.4 |
| 10 | 8 | 6 | 6 | 25 | 16.5 | 20.9 |
| 3 | 9 | 4 | 8 | 10 | 14.3 | 13.3 |
| 2 | 10 | 8 | 4 | 10 | 13.6 | 16.6 |
| 5 | 11 | 4 | 4 | 40 | 12.8 | 20.3 |
| 11 | 12 | 6 | 6 | 25 | 13.9 | 20.9 |
| 18 | 13 | 6 | 6 | 50.2 | 28.6 | 30.1 |
| 17 | 14 | 6 | 6 | 0.23 | 5.7 | 11.1 |
| 19 | 15 | 6 | 6 | 25 | 28.7 | 21 |
| 16 | 16 | 6 | 9.4 | 25 | 24.8 | 25.1 |
| 14 | 17 | 9.4 | 6 | 25 | 27.9 | 27.9 |
| 13 | 18 | 2.6 | 6 | 25 | 10.2 | 14.2 |
| 20 | 19 | 6 | 6 | 25 | 26.8 | 21.01 |
| 15 | 20 | 6 | 2.6 | 25 | 15.4 | 16.9 |
3. RESULTS AND DISCUSSION
3.1. Proximate Analysis of Pet Coke
Proximate analysis provides insights into the thermal decomposition and organic content of pet coke, which are critical for assessing its suitability in AD [17]. The result of proximate analysis for pet coke are shown in Table 3. The extremely low moisture content indicates that pet coke is a dry, hydrophobic material [18]. While this property is advantageous for storage and combustion, it presents a challenge in AD, where water is essential for microbial activity. The negligible volatile matter content suggests that pet coke contains very few compounds that can be easily gasified or metabolized by microorganisms [19]. This aligns with its highly condensed aromatic structure, which is resistant to biological breakdown.
Table 3: Proximate and ultimate analysis of pet coke.
| Parameter | Pet coke (wt.%) |
|---|
| Moisture | 0.46±0.02 |
| Ash | 13.22±0.01 |
| Volatile matter | 1.91±0.03 |
| Carbon | 72.54±0.1 |
| Hydrogen | 3.46±0.02 |
| Sulfur | 6.70±0.04 |
| SiO2 | 1.20±0.01 |
| AL2O3 | 0.22±0.01 |
| CaO | 0.14±0.04 |
| MgO | 0.02±0. 01 |
| TiO2 | 0.0 2±0.01 |
| Na2O | 0.17±0.03 |
| Fe2O3 | 0.16±0.02 |
| K2O | 0.003±0.01 |
3.2. SEM and XRD of Magnetic Fe2O3 NP
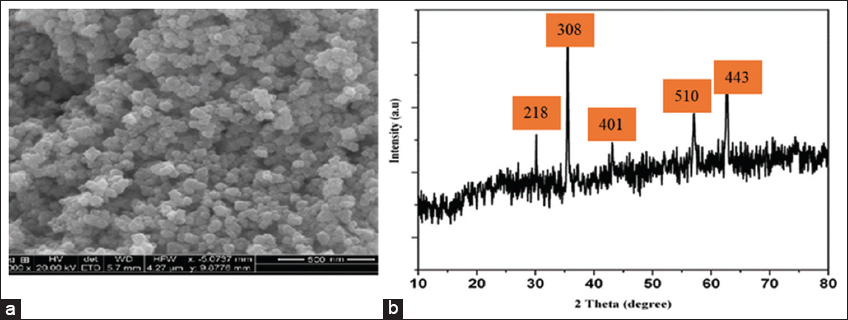
The SEM image of the synthesized magnetic ionocide NPs is presented in Figure 2a, revealing a relatively uniform and dense particle distribution. The NPs exhibit a quasi-spherical morphology and tend to aggregate a typical behavior observed in magnetic NPs due to dipole-dipole interactions [20]. Based on the scale bar (~500 nm), the individual particles appear to range between 40 nm and 80 nm in size, though aggregation may lead to an overestimation of their actual dimensions. In addition, the particles exhibit a rough texture, which could influence their surface area and reactivity.
The XRD pattern [Figure 2b] displays distinct peaks with corresponding 2θ values and Miller indices suggesting the crystalline nature of the NPs. The notable peaks at 218, 220, and 308 corresponds to plane, which are characteristic of spinel-type cubic ferrite structures, especially magnetite (Fe3O4) or maghemite (γ-Fe2O3), confirming magnetic iron oxide NPs [16,21]. The sharpness and intensity of the peaks indicate good crystallinity. So also, the most intense peak at 311 at an angle theta ~35.8° typically indicates the presence of magnetite [22].
3.3. RSM Model Equation
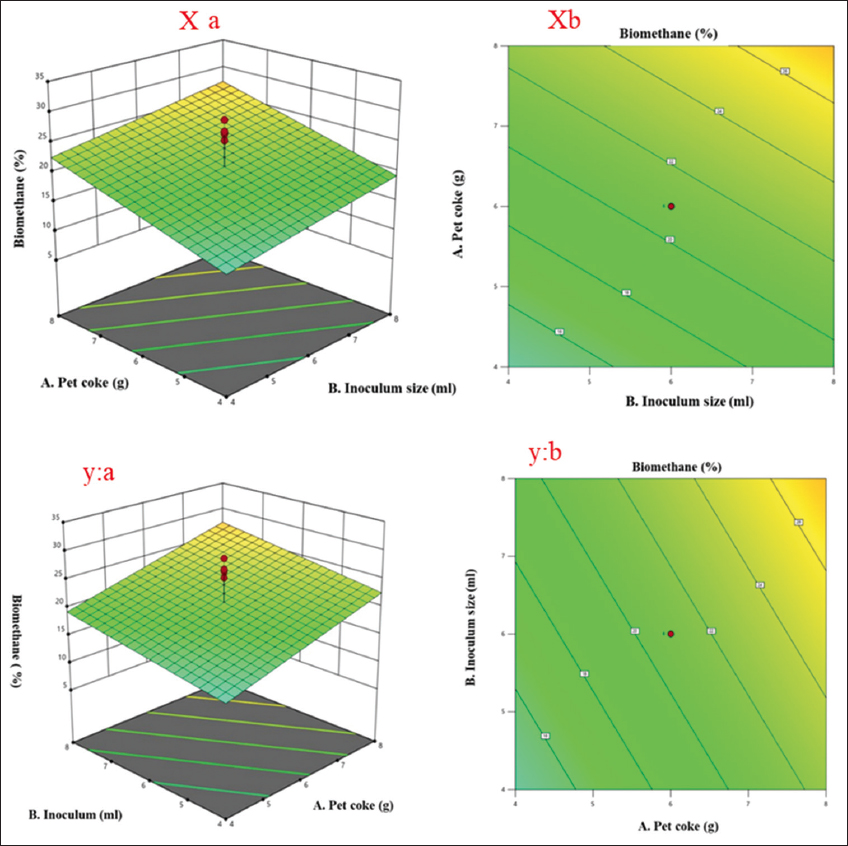
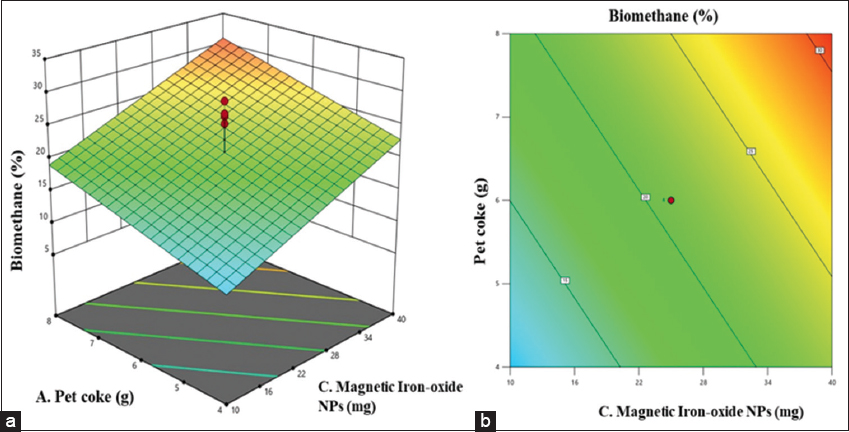
RSM is a widely applied statistical and mathematical approach used to model and optimize processes influenced by multiple variables [23]. Its primary objective is to determine the optimal conditions that maximize or minimize a desired response. In this context, the variables that influence the process are referred to as independent variables, whereas the outcomes or results are termed dependent variables [24]. For instance, biomethane yield (response) may be influenced by variables, such as X1 (biomass concentration) and X2 (inoculum size), with the yield varying across different combinations of these variables. The selection of independent variables and their respective limits is typically based on previous experimental studies or literature. In RSM, the experimental data are fitted to appropriate statistical models, which may include linear, quadratic, cubic, or two-factor interaction (2FI) models [14]. The model coefficients comprise a constant term, linear coefficients (A, B, C), interaction coefficients (AB, AC, BC), and quadratic coefficients (A2, B2, C2). The highest biomethane yield was obtained at a feedstock concentration of 8 g/L pet coke, with 8% (v/v) inoculum and 40 mg/L of magnetic iron oxide NPs. Under these conditions, the predicted biomethane yield was 33.2%, whereas the observed yield was 32.1%. Paired T-test confirmed no statistically significant difference between the two (P = 0.158).
The adequacy of the fitted model is evaluated through various statistical parameters, including the coefficient of determination (R2), adjusted R2, and adequate precision [25]. A model is generally considered statistically significant and reliable if the P-value < 0.05, the lack of fit P-value > 0.05, R2 > 0.9, and adequate precision >4. Furthermore, analysis of variance (ANOVA) is employed to assess the statistical significance of the model and the differences between treatment means [26].
3.4. Model Test Result
The selection of an appropriate model is a critical step in RSM as it significantly influences the accuracy and reliability of predictions related to biomethane yield [27]. In the present research work, various models, including linear, two-factor interaction (2FI), quadratic, and cubic, were evaluated to identify the best fit for the experimental data obtained from the AD of pet coke.
As presented in Table 4, the linear model demonstrates statistical significance with a P = 0.001, signifying that the model is significant and capable in explaining a substantial variation of biomethane production. The non-significant lack of fit P = 0.5857 indicates that the model sufficiently fits the empirical data, exhibiting minimal unexplained variability. Moreover, the model’s Adjusted R2 (0.5799) and predicted R2 (0.4135) values demonstrate moderate levels of explanatory and predictive efficacy, respectively. The relatively close alignment between these two metrics further substantiates the appropriateness of the linear model [28]. However, the 2FI model yielded a higher P = 0.4083, signifying that the interaction terms between factors did not significantly enhance model performance. As shown in Table 4 the adjusted R2 value (0.5837) of the 2FI model was marginally higher than that of the linear model and the predicted R2 (0.1032) was notably low, reflecting poor predictive ability. The non-significant lack of fit (P = 0.5804) does suggest that the model was not overfitting the data, but the weak prediction performance rendered it less favorable [29]. In addition, the quadratic model was found to performed poorly as evidenced by a high P-value (0.7433), a negative predicted R2 (−0.2606), and a relatively low adjusted R2 (0.513). These results imply that the model neither captures the variability in the response nor has predictive reliability. The insignificant lack of fit (P = 0.4492) was not sufficient to offset its poor performance metrics. Similarly, the cubic model showed the least reliability, with a high P-value (0.7287), a negative adjusted R2 (0.38), and an extremely poor predicted R2 (−57.6972), indicating severe overfitting or model misspecification. Furthermore, despite a non-significant lack of fit (P = 0.1583), this model was deemed aliased, meaning some terms are confounded and cannot be uniquely estimated, further disqualifying it for practical use.
Table 4: Lack of fit test.
| Model | P-value | lack of fit P value | Adjusted R2 | Predicted R2 | |
|---|
| Linear | 0.001 | 0.5857 | 0.5799 | 0.4135 | Suggested |
| 2FI | 0.4083 | 0.5804 | 0.5837 | 0.1032 | |
| Quadratic | 0.7433 | 0.4492 | 0.513 | −0.2606 | |
| Cubic | 0.7287 | 0.1583 | 0.38 | −57.6972 | Aliased |
3.5. ANOVA analysis for linear model
The ANOVA results presented in Table 5 provide essential insights regarding the factors affecting biomethane production in AD of pet coke. The model shows statistical significance, exhibiting an F-value of 9.28 and a P = 0.001. This indicates that the selected process variables, pet coke concentration (A), inoculum size (B), and magnetic ionocide NPs (C), collectively have a significant effect on biomethane yield, validating the adequacy of the fitted model in describing the experimental data. Among the individual factors, pet coke concentration exhibited a significant effect on biomethane production (F = 8.00, P = 0.0127). Variations in substrate load notably affect microbial activity and methane production. However, magnetic Fe2O3 NPs exhibited the highest significance (F = 16.96, P = 0.0009) among the tested variables. This is likely linked to their ability to enhance microbial metabolism and improve AD efficiency. Inoculum size was not significant (F = 2.89, P = 0.1097) at the 95% confidence level. Its impact may be more evident under varied conditions than those examined here. This can be supported with evidence that microbial processes are widely affected by multiple factors [30,31]. The insignificance indicates that optimization should focus on pet coke concentration and magnetic Fe2O3 NPs dosage for enhanced biomethane yield. Moreover, the lack of fit test was found to be non-significant with p value equating to 0.5857. This denotes that the developed model fits the experimental data and that the variation in the response can be explained by the model terms [12,32]. The relatively low pure error and residual mean square values support the model’s reliability and predictive capability. Overall, the statistics confirm that the model is moderately predictive and suitable for further optimization of biomethane production.
Table 5: ANOVA analysis for linear model.
| Source | Sum of squares | df | Mean square | F-value | P-value | |
|---|
| Block | 0.1141 | 1 | 0.1141 | | | |
| Model | 787.21 | 3 | 262.4 | 9.28 | 0.001 | Significant |
| A-pet coke | 226.1 | 1 | 226.1 | 8 | 0.0127 | |
| B-inoculum size | 81.73 | 1 | 81.73 | 2.89 | 0.1097 | |
| C-magnetic Fe2O3 NPs | 479.39 | 1 | 479.39 | 16.96 | 0.0009 | |
| Residual | 423.97 | 15 | 28.26 | | | |
| Lack of fit | 304.75 | 11 | 27.7 | 0.9296 | 0.5857 | Not significant |
| Pure error | 119.21 | 4 | 29.8 | | | |
| Cor total | 1211.29 | 19 | | | | |
The regression coefficient analysis is presented in Table 6 revealing C (Fe2O3) factor had the most significant influence on biomethane yield with a coefficient of 5.92 and a P = 0.0009, respectively. Both factors showed a positive and statistically significant effect, indicating that increasing these parameters enhances biomethane production during the AD of pet coke. However, factor B exhibited a positive but statistically insignificant effect P = 0.1097, implying that its individual contribution to the response may be limited or dependent on interaction with other variables.
Table 6: Coefficients of factors.
| Intercept | block 1 | A | B | C |
|---|
| Biomethane | 20.9354 | −0.077083 | 4.06885 | 2.44631 | 5.92472 |
| P-value | | | 0.0127 | 0.1097 | 0.0009 |
3.6. Model Validation and Diagnostic Analysis
The performance of the RSM based model was evaluated through validation experiments and diagnostic plots. The objective was to assess how well the model could predict biomethane yield based on selected process variables: Pet coke (biomass) concentration, inoculum size, and magnetic Fe2O3 NPs dosage. Table 7 presents the experimental validation of the model using three sets of operating conditions predicted by the model development phase. The comparison between the predicted and actual biomethane yields demonstrates a high degree of agreement, indicating the model robustness and predictive accuracy. For example, in Run 6, where 8 g of biomass, 8 mL of inoculum size, and 40 mg of magnetic NPs were used, the actual Biomethane yield was 32.4%, closely aligning with the model’s prediction. Similarly, Run 16 (6 g biomass, 9.4 mL inoculum, and 25 mg NPs) produced 24.3% biomethane yield and Run 17 (4 g biomass, 8 mL inoculum, and 40 mg NPs) resulted in 27.6% biomethane yield, both in close proximity to the corresponding model predictions. The low absolute error between predicted and experimental values across all runs confirms the model’s capability to accurately forecast biomethane output across the design space. These results validate the effectiveness of the second-order polynomial equation in representing the experimental system.
Table 7: Model validation results.
| Run No. | Biomass (g/L) | Inoculum size% (v/v) | Magnetic Fe2O3 NPs (mg/L) | Biomethane yield (%) |
|---|
| 16 | 6 | 9.4 | 25 | 24.3 |
| 6 | 8 | 8 | 40 | 31.1 |
| 17 | 4 | 8 | 40 | 27.5 |
This scatter plot [Figure 3a] evaluates the model predictive performance by comparing predicted and experimental values. The close clustering of data points along the 45° line (Y = X) signifies a high correlation and indicates that the model neither systematically overpredicts nor underpredicts the response. The near-linear fit validates the accuracy of the RSM model and reinforces the strength of the regression relationship. So also, the differences between observed and predicted values [Figure 3b], are plotted against the predicted values to assess model assumptions. A random scatter of residuals around the zero line is evident with no discernible pattern, indicating that the model satisfies the assumption of homoscedasticity (constant variance) [33]. This further proves that the variance of the prediction errors is stable across the range of predicted values, supporting the reliability of the model. In addition, Figure 3c depicts how residuals behave with respect to the order of experimental runs. The distribution of residuals appears to be randomly scattered without any visible trends, cycles, or drift. This suggests that there are no lurking variables or time-related biases affecting the experimental runs. The consistency across run order confirms proper randomization of experimental trials and adds confidence in the validity of the experimental design.
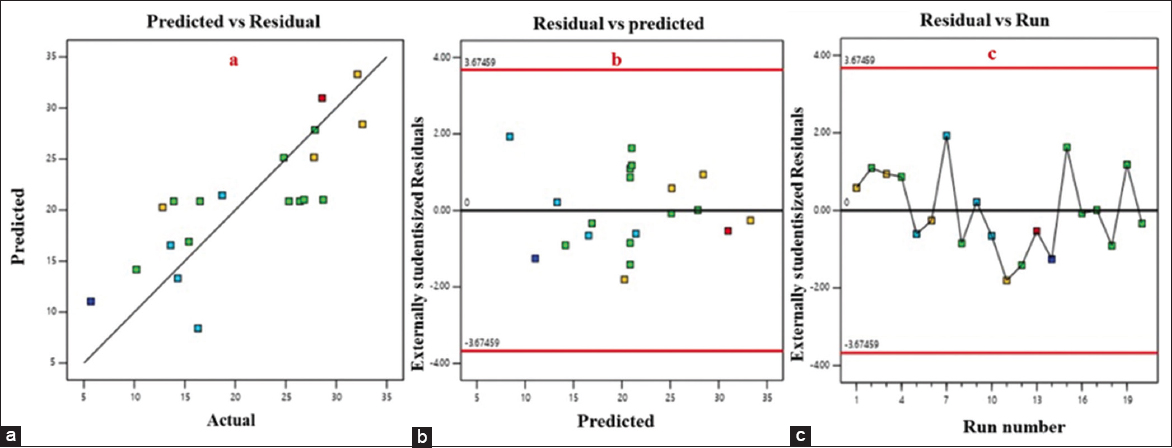 | Figure 3: (a) Graph of predicted and actual values, (b) Graph of predicted and residual values, (c) Graph of predicted and run values - experiment deviations.
[Click here to view] |
REFERENCES
1. Sikiru S, Abioye KJ, Adedayo HB, Adebukola SY, Soleimani H, Anar M. Technology projection in biofuel production using agricultural waste materials as a source of energy sustainability: A comprehensive review. Renew Sustain Energy Rev. 2024;200:114535.[CrossRef]
2. Zhang J. Energy access challenge and the role of fossil fuels in meeting electricity demand:Promoting renewable energy capacity for sustainable development. Geosci Front. 2024;15:101873.[CrossRef]
3. Majeed Y, Khan MU, Waseem M, Zahid U, Mahmood F, Majeed F, et al. Renewable energy as an alternative source for energy management in agriculture. Energy Rep. 2023;10:344-59.[CrossRef]
4. Rasapoor M, Young B, Brar R, Sarmah A, Zhuang WQ, Baroutian S. Recognizing the challenges of anaerobic digestion:Critical steps toward improving biogas generation. Fuel. 2020;261:116497.[CrossRef]
5. Uddin MM, Wright MM. Anaerobic digestion fundamentals, challenges, and technological advances. Phys Sci Rev. 2023;8:2819-37.[CrossRef]
6. Ferdous AR, Shah SS, Shah SN, Johan BA, Al Bari A, Aziz A. Transforming waste into wealth:Advanced carbon-based electrodes derived from refinery and coal by-products for next-generation energy storage. Molecules. 2024;29:2081.[CrossRef]
7. Mishra S, Panda S, Pradhan N, Satapathy D, Biswal SK, Mishra BK. Insights into DBT biodegradation by a native Rhodococcus strain and its sulphur removal efficacy for two Indian coals and calcined pet coke. Int Biodeterior Biodegrad. 2017;120:124-34.[CrossRef]
8. Lu Z, Wang H, Wang Z, Liu J, Li Y, Xia L, et al. Critical steps in the restoration of coal mine soils:Microbial-accelerated soil reconstruction. J Environ Manage. 2024;368:122200.[CrossRef]
9. Van Coller C, do Amaral Filho JR, Smart M Harrison, S.T.L. (2025). Bioaugmentated Technosols as a Nature-Based Strategy for Mine-Site Rehabilitation. In:Metallurgy and Materials Society of CIM (eds) Proceedings of the 63rd Conference of Metallurgists, COM 2024. COM 2024. Springer, Cham.[CrossRef]
10. Ríos Á, Zougagh M. Recent advances in magnetic nanomaterials for improving analytical processes. TrAC Trends Anal Chem. 2016;84:72-83.[CrossRef]
11. Gupta N, Koley A, Banerjee S, Ghosh A, Hoque RR, Balachandran S Nanomaterial-mediated strategies for enhancing bioremediation of polycyclic aromatic hydrocarbons:A systematic review. Hybrid Adv. 2024;7:100315.[CrossRef]
12. Chang PY, Chan YJ, Arumugasamy SK, Wan YK, Lim JW. Optimisation of anaerobic digestion of palm oil mill effluent with biochar addition:Synergistic application of Artificial neural network and response Surface Methodology. Fuel. 2025;398:135514.[CrossRef]
13. Aseibichin C, Chukwuemeke Ulakpa W, Omenogor I, Doyah E, Olaseinde AA, Anakpoha OC, et al. Modeling and optimization of transesterification of Jatropha oil to fatty acid methyl ester:Application of response surface methodology (CCD) and Taguchi orthogonal method. RSC Adv. 2024;14:11784-96.[CrossRef]
14. Raei B. Modeling and optimization of thermal conductivity of stabilized g-Al2O3/water nanofluid using response surface methodology (RSM). J Chem Pet Eng. 2024;59(1):1-22.
15. Adeeyo AO, Alabi MA, Oyetade JA, Nkambule TT, Mamba BB, Oladipo AO, et al. Magnetic nanoparticles:Advances in synthesis, sensing, and theragnostic applications. Magnetochemistry. 2025;11:9.[CrossRef]
16. Arévalo P, Isasi J, Caballero AC, Marco JF, Martin F. Magnetic and structural studies of F3O4 nanoparticles synthesized via coprecipitation and dispersed in different surfactants. Ceram Int. 2017;43:10333-40.[CrossRef]
17. Seah CC, Habib SH, Hafriz RS, Shamsuddin AH, Razali NM, Salmiaton A. Prospective energy content assessment of waste biomass and polymer via preliminary analysis. Results Eng. 2024;22:102301.[CrossRef]
18. Prabhakaran SP, Swaminathan G, Joshi VV. Thermogravimetric analysis of hazardous waste:Pet-coke, by kinetic models and Artificial neural network modeling. Fuel. 2021;287:119470.[CrossRef]
19. Murthy BN, Sawarkar AN, Deshmukh NA, Mathew T, Joshi JB. Petroleum coke gasification:A review. Can J Chem Eng. 2014;92:441-68.[CrossRef]
20. Nedylakova M, Medinger J, Mirabello G, Lattuada M. Iron oxide magnetic aggregates:Aspects of synthesis, computational approaches and applications. Adv Colloid Interface Sci. 2024;323:103056.[CrossRef]
21. Compeán-Jasso ME, Ruiz F, Martínez JR, Herrera-Gómez A. Magnetic properties of magnetite nanoparticles synthesized by forced hydrolysis. Mater Lett. 2008;62:4248-50.[CrossRef]
22. Grifasi N, Deorsola FA, Fino D, Piumetti M. Mesoporous TiO2 and Fe-containing TiO2 prepared by solution combustion synthesis as catalysts for the photodegradation of paracetamol. Environ Sci Pollut Res. 2024;31:36861-81.[CrossRef]
23. Kim J, Kim DG, Ryu KH. Enhancing response surface methodology through coefficient clipping based on prior knowledge. Processes. 2023;11:3392.[CrossRef]
24. Rajewski J, Dobrzynska-Inger A. Application of response surface methodology (RSM) for the optimization of chromium(III) synergistic extraction by supported liquid membrane. Membranes. 2021;11:854.[CrossRef]
25. Uche CU, Okezue MA, Amidu I, Byrn SR. Model adequacy in assessing the predictive performance of regression models in pharmaceutical product optimization:The bedaquiline solid lipid nanoparticle example. Sci Pharm. 2024;92:64.[CrossRef]
26. Sinaei Nobandegani M, Sardashti Birjandi MR, Darbandi T, Langerudi MK, Shahraki F, Mohebbi-Kalhori D. An industrial Steam Methane Reformer optimization using response surface methodology. J Nat Gas Sci Eng. 2016;36:540-9.[CrossRef]
27. Reza A, Chen L, Mao X. Response surface methodology for process optimization in livestock wastewater treatment:A review. Heliyon. 2024;10:30326.[CrossRef]
28. Kumari M, Gupta SK. Response surface methodological (RSM) approach for optimizing the removal of trihalomethanes (THMs) and its precursor's by surfactant modified magnetic nanoadsorbents (sMNP) - An endeavor to diminish probable cancer risk. Sci Rep. 2019;9:18339.[CrossRef]
29. Kunjiappan S, Ramasamy LK, Kannan S, Pavadai P, Theivendren P, Palanisamy P. Optimization of ultrasound-aided extraction of bioactive ingredients from Vitis vinifera seeds using RSM and ANFIS modeling with machine learning algorithm. Sci Rep. 2024;14:1219.[CrossRef]
30. Gonzalez JM, Aranda B. Microbial growth under limiting conditions-future perspectives. Microorganisms. 2023;11:1641.[CrossRef]
31. Podolak R, Whitman D, Black DG. Factors affecting microbial inactivation during high pressure processing in juices and beverages:A review. J Food Prot. 2020;83:1561-75.[CrossRef]
32. Veza I, Spraggon M, Fattah IM, Idris M. Response surface methodology (RSM) for optimizing engine performance and emissions fueled with biofuel:Review of RSM for sustainability energy transition. Results Eng. 2023;18:101213.[CrossRef]
33. Mia M. Mathematical modeling and optimization of MQL assisted end milling characteristics based on RSM and Taguchi method. Measurement. 2018;121:249-60.[CrossRef]
34. Myers RH, Montgomery DC, Geoffrey VG, Borror CM, Kowalski SM. Response surface methodology:A retrospective and literature survey. J Qual Technol. 2004;36:53-77.[CrossRef]
35. Asaad SM, Inayat A, Ghenai C, Shanableh A. Response surface methodology in biodiesel production and engine performance assessment. Int J Thermofluids. 2024;21:100551.[CrossRef]
36. Pan K, Wei Y, Qiu C, Li H, Wang L, Cheng L, et al. Comprehensive analysis of effects of magnetic nanoparticles on aerobic granulation and microbial community composition:From the perspective of acyl-homoserine lactones mediated communication. Bioresour Technol. 2024;393:130174.[CrossRef]
37. Rana S, Kumar A. Toxicity of nanoparticles to algae-bacterial co-culture:Knowns and unknowns. Algal Res. 2022;62:102641.[CrossRef]
38. Adeleke BS, Olowe OM, Ayilara MS, Fasus OA, Omotayo OP, Fadiji AE, et al. Biosynthesis of nanoparticles using microorganisms:A focus on endophytic fungi. Heliyon. 2024;10:39636.[CrossRef]
39. Kumar VK, Kumargouda V. Investigation on effect of pH level of substrate by lime water and acetic acid treatment on biogas production through anaerobic digestion. Sustain Energy Res. 2025;12:34.[CrossRef]
40. Amez I, Castells B, León D, Paredes R. Study of quaternary hydrogen and biogas mixtures:An industrial safety approach. Fuel. 2025;381:133663.[CrossRef]
41. Molatudi LE, Kunene TJ, Mashifana T. Strategies for biomethane purification:A critical review and new approaches. GCB Bioenergy. 2025;17:70040.[CrossRef]
42. Wani SS, Parveez M. Quality and potential assessment of sewage sludge for clean energy utilization:a study from Srinagar City. Biomass Conversion and Biorefinery. 2025;02:12.[CrossRef]
43. Kazimierowicz J, Debowski M, Zielinski M. Innovative method for biomethane production based on a closed cycle of biogas upgrading and organic substrate pretreatment-technical, economic, and technological fundamentals. Energies. 2025;18:1033.[CrossRef]
44. Jacob S, Kundu D, Chintagunta AD, Nunne SK, Samanta P, Mahata C, et al. Anaerobic digestion-derived digestate valorization:Green chemistry innovations for resource recovery and reutilization. Green Chem. 2025.[CrossRef]
45. Vasan V, Sridharan NV, Feroskhan M, Vaithiyanathan S, Subramanian B, Tsai PC, et al. Biogas production and its utilization in internal combustion engines - A review. Process Saf Environ Prot. 2024;186:518-39.[CrossRef]